The use of polymeric polyols is commonplace in the manufacturing of polyurethanes and other specialty polymers. The hydroxyl number (OH#) is a measure of the concentration of the hydroxyl groups on the polyol. The number of reactive hydroxyl groups (OH) on the polyol directly impacts the quantity of urethane linkages, which greatly influences the physical properties of the final polyurethane product. This is an important parameter to monitor and control during polyol production. The laboratory method that is commonplace for hydroxyl number determination is both time consuming and involves the use of hazardous materials. This note will discuss the use of our GUIDED WAVE™ hardware and software tools for the measurement of hydroxyl number in polyols using fiber optic-based, Near-Infrared (NIR) spectroscopy. NIR can be applied in real time directly in process or as a laboratory procedure. In either case NIR is a time and money saving alternative to traditional methods. NIR also offers the benefit of increased safety over traditional methods.
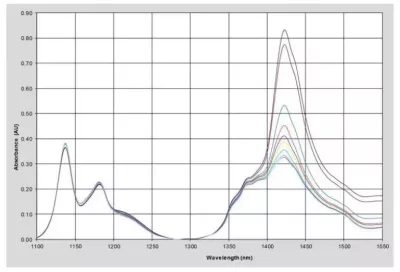
Figure 1: NIR Spectra of Polyether Polyol Samples
Background Information on Measuring Polyols using Process NIR Spectroscopy
The NIR region of the electromagnetic spectrum allows the use of the overtone and combination bands of the C-H, O-H, and N-H fundamentals. By measuring the NIR spectra of a series of polyol samples of known hydroxyl number, a quantitative model can be developed which will allow the measurement of hydroxyl number in future samples based only on their NIR spectrum. Guided Wave analyzer systems use fiber optics to allow the sample probe to be located in remote locations away from the spectrometer itself.
Experiment to Measure Polyols using NIR
The NIR spectra of a group of different process polyether polyol samples were measured between 1000 and 1600 nm using a NIR-O Spectrometer. Figure 1 shows the absorbance spectra of some representative samples using an on-line process probe with a 1 cm pathlength. The hydroxyl number for these samples ranges from 9 to 44. For this application, data preprocessing consisted of a simple 2-point baseline correction to remove any offset. The spectra and concentration data were submitted to the third party chemometrics software and a calibration model was developed using PLS regression methodology. For a discussion of PLS and other multivariate calibration techniques please see Martens & Naes1 and ASTM E1655 2.
Analyzer Selection
For well-established process measurements, our ClearView® db multi-wavelength photometer can be used to achieve similar results. The photometer systems offer robust measurement capability for a more focused set of applications. Contact us for guidance on the choice between measurement systems.


SALES | TRAINING | SERVICE
Americas +1.916.638.4944
EMEA +49 69 20436910
China/APAC +86 400 086 0106
USEFUL NIR UV-VIS Troubleshooting Guides & Technical Resources


Figure 2: OH Number, Laboratory vs. NIR
Results
The model was used to predict hydroxyl number values in a laboratory setting. The results are shown in Figure 2 as a scatter plot. The model produced a RMSEP (root mean square error of prediction) of 1.8. This is in good agreement with the accuracy of the standard laboratory method.
The measurement of OH number of polyols using NIR spectroscopy is both fast and reliable utilizing the GUIDED WAVE hardware and software tools as described here. This method minimizes the need for performing the previous laboratory method and hence the results are available in real-time (seconds). This method can be applied in a batch reactor system for control of this important property during mixing and to determine the endpoint of the reaction thus resulting in significant savings of time and material costs. For more detailed information regarding system specifications please contact us.
Our comprehensive GUIDED WAVE NIR UV-VIS process and lab analyzer spectrometers offer optically matched components and a meticulously planned calibration approach, ensuring long-term efficiency and cost savings. Our advanced systems are engineered for continuous online operation, delivering real-time data of laboratory-grade quality, even in the harshest processing plant conditions.
References
1. H. Martens, T. Naes, Multivariate Calibration, John Wiley & Sons, 1989.
2. ASTM E1655 Standard Practices for Infrared, Multivariate, Quantitative Analysis.