The addition of stabilizers such as hindered phenols, phosphites, hindered amines, and benzotriazoles to polyolefins provide protection from oxidation due to heat, light, or stress. Polymer performance is directly related to the level of stabilizer. As a result, measurement and control of the additive concentration that is melt compounded into the polymer are crucial. Making these spectroscopic measurements in the polymer melt offers many advantages over current offline quality control methods such as gas chromatography (GC) and high-performance liquid chromatography (HPLC). This paper will discuss an online method for monitoring the levels of hindered phenols and phosphites in polypropylene. This method is based on UV spectroscopy coupled with fiber optics. Data will be presented to show the successful measurement of these additives even in the presence of potential interferants.
Introduction
The performance of a polyolefin is dependent upon the levels of additives that are compounded into the polymer. It is advantageous, therefore, to control the amount of additive in the final product melt. The current offline methods of control for these additives include gas chromatography (GC) and high-performance liquid chromatography (HPLC). In addition to being off-line analyses, these methods are often time consuming and labor intensive. It is not uncommon to have several hours delay between the collection of a sample and the reporting of analytical results. In that time several thousand pounds of out of specification polymer may have been produced. Online, or inline, UV spectrophotometric analysis is an effective way of providing real time (< 30 seconds) measurement of the antioxidant additives in the polymer melt. Real time analysis allows for more stringent control of the additive concentrations to meet the target specifications of the final product. In turn, the final product will more often meet specifications and less scrap material will be produced.
There are a myriad of polymer additives, and additive packages (combinations of individual additives in predetermined ratios) being utilized by manufacturers of polymers. The purpose of any particular additive is dependent upon its chemical structure. The additives may improve the characteristics of the target polymer in its end use form. An additive may also aid in the process ability of the polymer. This paper will focus on the measurement of both primary and secondary antioxidants in a polyolefin melt by online UV fiber optic spectroscopy.
Theory
Measurement of the concentration of an antioxidant additive in a polymer melt is typically accomplished offline in an analytical laboratory. The most common analysis methods are GC and HPLC. The gathering of samples, preparation, and analysis is often time consuming and labor intensive. However, the monitoring of a polyolefin melt online provides real time results (< 30 seconds) for additive control. This can be accomplished with UV spectroscopy (Figure 1). Ultraviolet spectroscopy is based upon the measurement of the amount of light absorbed, (or transmitted), through sample when exposed to a known amount of light. The ultraviolet region contains the wavelengths from approximately 200 nm to 400 nm. The amount of light absorbed by a sample can be correlated, through Beer’s Law, to the additive concentration in that sample. The antioxidants in this study exhibit overlapping, but characteristic absorption bands in the ultraviolet region. In particular, phenolic and carbonyl functional groups exhibit strong UV absorption. A typical online analyzer system is composed of a computer-controlled UV spectrometer, single strand fiber optic cables, probe(s), and communication hardware to connect with the control computer (DCS). For hostile environments, the analyzer can be packaged in a NEMA 4 enclosure.
A fiber optic cable transmits light from the spectrometer to a probe which interfaces with the sample. The sample will absorb some of this incident radiation based upon the molecular structure. The remaining light is transmitted back to the analyzer. The optical fiber is silica based with environmentally sound process packaging. The probes are typically fabricated from stainless steel and contain sapphire windows and lenses to collimate the light beam. These probes are manufactured to withstand the extreme temperatures and pressures found in the process environment. The analyzer software is designed for advanced data treatment, spectral analysis, instrumental control and functional diagnostics, calibration development, and process monitoring tasks (trend charts, logging, etc.).
The antioxidant’s role is to prevent the propagation of oxidation in the polymer melt. The most common primary antioxidants are hindered phenol’s. These antioxidant compounds act as scavengers of free radicals by “donating” their reactive hydrogens to the free radical. This stops the formation of subsequent free radicals and the oxidation reaction is terminated.
Secondary antioxidants, typically organophosphites, target the unstable hydroperoxide, reducing it to an alcohol. The antioxidants under study display characteristic absorption of UV light (200 nm- 400 nm) due to their chemical composition. By correlating the quantity of an additive with its unique absorption band, on-line analysis by UV fiber optic spectroscopy is successful in effectively monitoring polyolefin antioxidant additive levels.


SALES | TRAINING | SERVICE
Americas +1.916.638.4944
EMEA +49 69 20436910
China/APAC +86 400 086 0106
USEFUL NIR UV-VIS Troubleshooting Guides & Technical Resources

Experimental
The samples for this study were all run on a Wayne 1.25-inch single screw extruder. The polyolefin resins were extruded at approximately 450 °F, a pressure of 600-650 psi, and a screw speed of 35 rpm. Our GUIDED WAVE™ UV VIS spectroscopic analyzer was interfaced to the extruder through two fiber optic cables and a set of light collimating transmission probes. The sample measurement location was at the extruder die where the polymer is molten and before any coolers or pelletizers (Figure 2). Spectral measurements, relative to a background reference scan, were taken in absorbance units (AU) from 250 nm to 450 nm. Four scans per sample were averaged to produce a single UV spectrum. Data correlation and modeling of the data sets was performed using a third party multivariate calibration software package. The resulting model file can be converted for online use in the analyzer software.

Figure 1 Trend Chart of Online NIR measurements compared to QC Lab Validation
Preliminary laboratory work indicated that online measurement might be feasible. Samples of Himont Profax 6501 resin containing known amounts of antioxidant additives were extruded. One sample set consisted of a primary antioxidant (referred to as AOX1) and a secondary antioxidant (AOX2) in varying ratios. The goal was to determine both the primary and secondary antioxidant concentrations. The second sample set consisted of a phenolic antioxidant (AOX3) and a slip agent (SL1). The purpose of the second set is to determine if the slip agent might interfere with the measurement of the antioxidant.
Feasibility Study: UV Spectroscopy for Online Measurement of Polymer Additives
Spectral scans of the first data set containing the two antioxidants were collected for each of the varying concentrations. The spectra were baseline corrected to eliminate any baseline changes. These small offsets across the entire spectrum are primarily due to changes in the refractive index of the individual samples, or occasionally to some slight instrument drift. In either case, a baseline correction compensates for the small offset.

Figure 2 Diagram of the Flow Cell installed after the extruder
The spectral scans were then correlated to the known concentration values for each of the samples. This was done through a partial least squares (PLS) algorithm in the multivariate calibration program. A cross-validation, or “leave one out”, technique was utilized for validation. For example, a sample scan is removed from the calibration set and a model is created utilizing the remaining samples. This model then predicts the value of the originally removed sample as if it were an “unknown.” This is done for each sample in the data set and provides a measure of the predictive ability of a model. It is important to note that as a “secondary” method UV spectroscopy relies upon the values (concentrations) provided by a primary method. The accuracy of the secondary method will only be as good as the accuracy of the primary method. In this study the samples were prepared gravimetrically and this becomes the “primary method.” The primary method may also be a laboratory analysis (GC or HPLC for example). However, the precision of on-line spectroscopy is often superior to the primary method.
The first calibration set of AOX1 and AOX2 contained sixteen samples with varying levels of antioxidant, ranging from 250 ppm to 1500 ppm. The prediction results are shown in Tables 1 and 2. Correlation plots for each of the antioxidants are shown in Figures 3 and 4. The standard error of prediction (SEP) for AOXl is determined to be 18 ppm. The SEP for AOX2 is slightly higher at 30 ppm. The results are promising but lead to observations. These samples were prepared gravimetrically. Therefore, the antioxidant concentrations were determined before the samples were introduced to the extruder. The “known” values were not determined independently after extrusion. Sample stratification, poor mixing, and other factors could have resulted in erroneous assumptions about the true concentration. In addition, the antioxidants may have reacted (as they are intended to) or degraded. A more accurate primary measure of melt composition would be to have the final melt compounded product analyzed in the laboratory to validate the concentrations of antioxidant in the polyolefin.

Table 1 AOX1 Calibration Set

Figure 3 Antioxidant Calibration – AOX1 Octadecyl3,5-bis (1,1-dimethylethyl)-4-hydroxybenzene propanoate
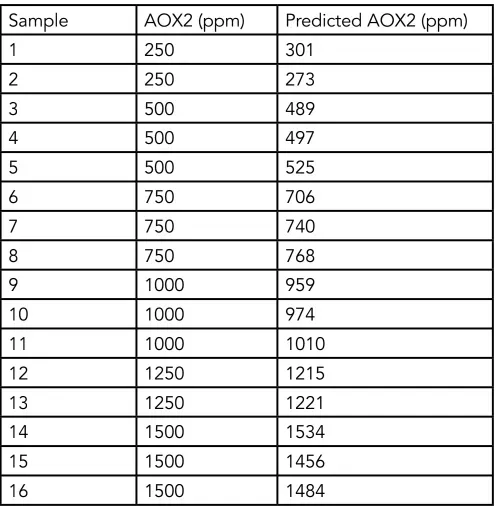
Table 2 AOX2 Calibration Set
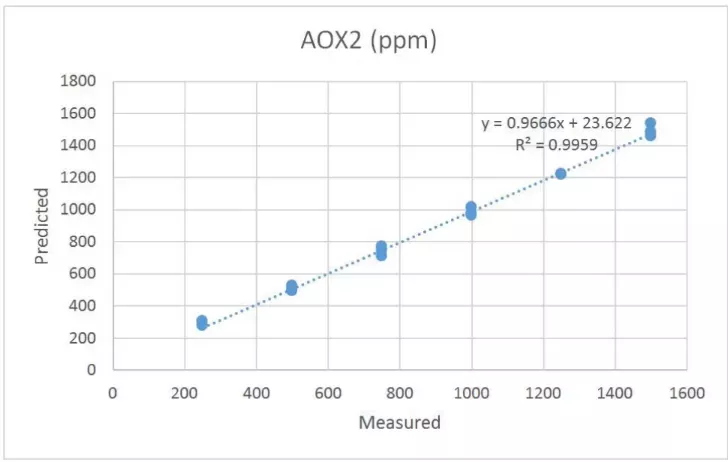
Figure 4 Antioxidant Calibration – AOX2 2,4-Bis(1,1-dimethylethyl)phenyl-phosphite (3:1)
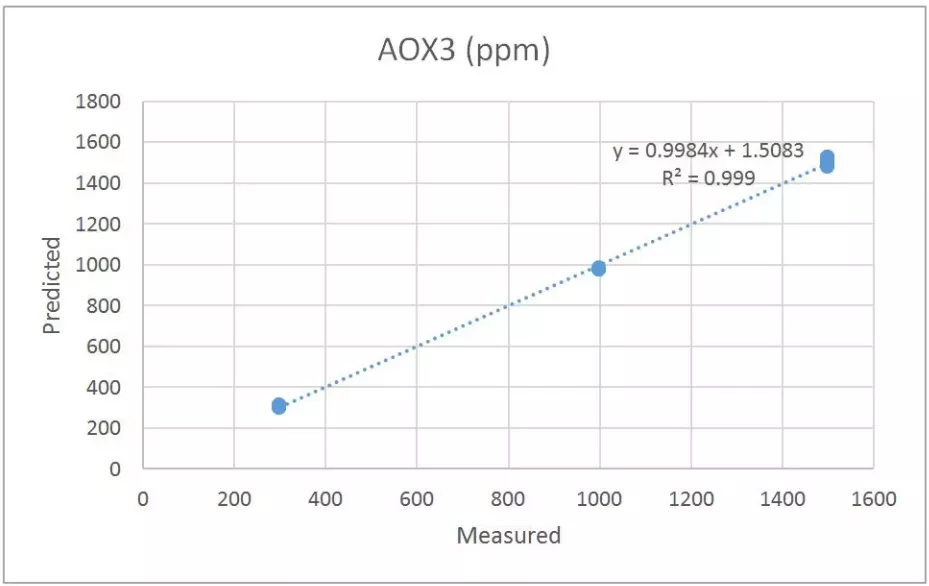
Figure 5 Antioxidant Calibration – AOX3 Tetrakis[methylene(3,5-di-tert-butyl-4-hydroxyhydrocinnamate)]methane
