Water is perhaps the most common measurement made in the near infrared (NIR). This is due to its strong effect on product properties and chemical reactivity of the starting materials. From an analytical perspective, water is easy to analyze due to its relatively strong signal compared to the hydrocarbon background.
Moreover, because water is commonly analyzed with a single wavelength, photometers are the instrument of choice. The purpose of this application note is to show you how we arrive at recommending a system, that is, a photometer with the proper wavelengths and a fiber optic probe with an appropriate sample path length.
- (1) background hydrocarbon spectral characteristics, (2) concentration range of water and desired analytical precision, (3) potential interference from hydroxyl, (4) sample temperature variations, and (5) sample clarity. These considerations affect the choice (and price) of the appropriate photometer and probe system.
- (1) provide maximum sensitivity, (2) select wavelength(s) to keep the absorbance below 1.2 Absorbance Units (AU), (3) minimize interference due to background hydrocarbon variations and sample temperature changes, and (4) use an optical path of >1 mm in the fiber optic probe for ease of cleaning and minimal entrapment of bubbles and particles.
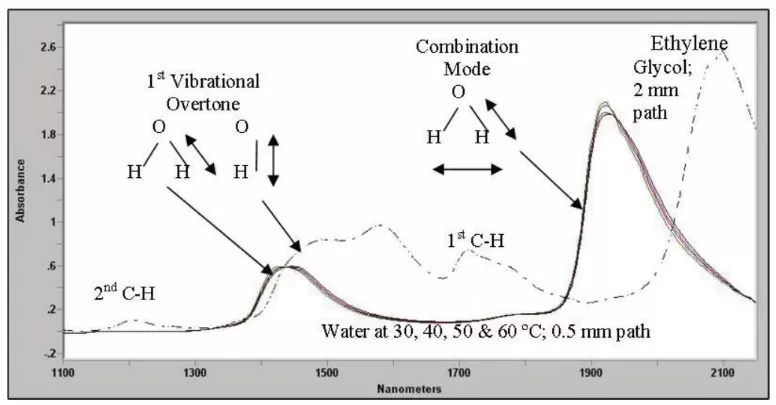
Figure 1 Location of various NIR absorbance peaks for water relative to the absorbance of Ethylene Glycol.
Rule-of-Thumb
The 1900 nm region is generally used for <1% water. With our ClearView® db photometer, a precision near ±20 ppm can be achieved. The 1400 nm region is used for >1% water and a precision of near ±100 ppm is attainable. For process analyzers, long-term (monthly) photometric drift is the most meaningful measure of “precision”. With a ClearVIew db photometer, this is typically <500μAU.


SALES | TRAINING | SERVICE
Americas +1.916.638.4944
EMEA +49 69 20436910
China/APAC +86 400 086 0106
USEFUL NIR UV-VIS Troubleshooting Guides & Technical Resources

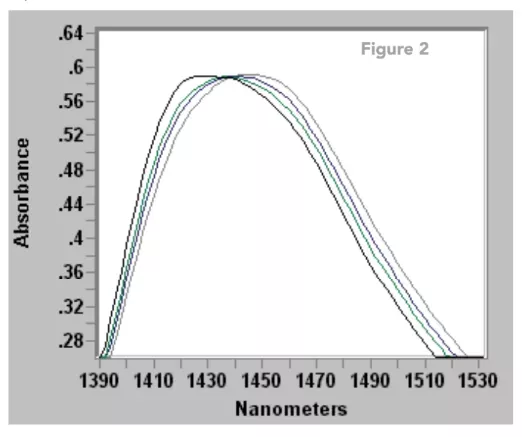
Temperature Effects
The top of the water peak near 1430 nm is shown in Figure 2. These spectra represent water at different temperatures from 30 to 60 oC. They intersect at 1430 nm. There is an analogous intersection on the 1900 nm peak shown on the previous page. This means that different temperatures have different calibration curves. In some of our studies of percent water in acids in the 1400 nm region, a 1 oC change can lead to a 0.1% (1000 ppm) change in the calculated water concentration. There are several methods to minimize sample temperature effects. The piping in a side stream can be heat traced or the wavelength at the spectral intersection point can be used for the calibration. Perhaps the most common solution is to measure the sample temperature with an RTD sensor or thermocouple near the probe and send the signal back to the ClearView® db photometer. The software is equipped to correct water calibrations for sample temperature variations.