Clearview Guides
Is your ClearView db analyzer displaying an alarm about low light?
In the normal (installed) configuration it can be difficult to know where the analyzer’s problem is coming from, due to many signals being tied together.
If the ClearView db has low light levels (counts data) coming from either Channel A or Channel B it is difficult to tell if the issue is:
- the internal optics
- the fiber optic cable connecting the probe and the analyzer
- a transmission problem with the probe
- an unexpected variation in process stream conditions
Follow these steps to help determine what is causing the low light error and how to best resolve it.
When a ClearView db is shipped there are tools included for troubleshooting the system if problems arise:
- a spare fiber jumper
- an SMA union
- a 5/16” wrench
The best way to figure out the problem and isolate the issue is to try several reconfigurations (steps 1-4 below).
If all 4 reconfigurations are completed, and good data is captured during each one, the problem causing the low counts should be isolated. The procedure below is specific to troubleshooting a single channel Clearview. The 2 channel analyzers, the procedure can be repeated for channel B.
The most useful and complete data can be collected by enabling the data logging option (de-bugging information). It is recommended that this is turned on before collecting the data from each troubleshooting configuration. (Data Logging Instructions)
Troubleshooting Reconfiguration Steps
1) Field Bypassed: Remove the Channel A fibers at the analyzer and install a test fiber to loop the light back into the analyzer. This configuration removes the fibers, probe and process from the analyzer and the readings reflect only the operation of the analyzer.
- Take counts readings for Channel A, Reference and Dark.

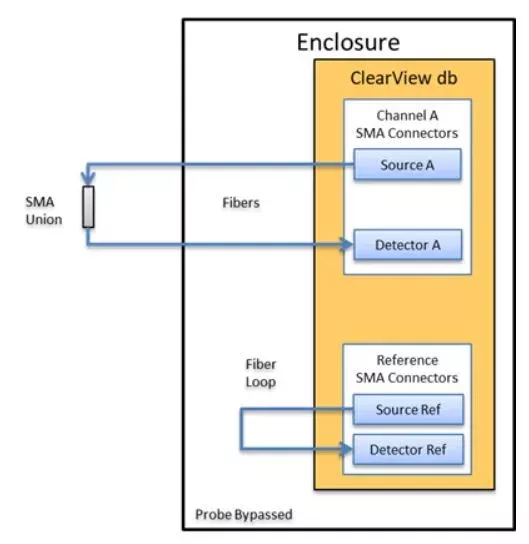
2) Probe Bypassed: Reinstall the Channel A fibers and jumper out the probe with an SMA union. This configuration extends the analyzer functionality to include the process fibers but not the probe or process.
- Take counts readings for Channel A, Reference and Dark.

2) Probe Bypassed: Reinstall the Channel A fibers and jumper out the probe with an SMA union. This configuration extends the analyzer functionality to include the process fibers but not the probe or process.
- Take counts readings for Channel A, Reference and Dark.
3) Normal Configuration (Clean Probe no Process): Return the system to Normal operating configuration by connecting the probe to the field fibers. With a clean probe and no process
- Take counts readings for Channel A, Reference and Dark.
4) Normal Configuration (Probe in Process): Return the system to Normal operating configuration by connecting the process to the probe for normal operation.
- Take counts readings for Channel A, Reference and Dark.
Send the data collected to info@process-insights.com for review by our service team.
User Interface Flow Chart to Turn On Data Logging: Data Logging Instructions ClearviewDB_v23
