This application discusses the use of our hardware and software tools for the measurement of various triazines using fiber optic-based, UV-VIS spectroscopy. Our product line includes the GUIDED WAVE™ 508 UV-VIS™ Full Spectrum Process Analyzer. UV-VIS spectroscopy can be applied in real time directly in process monitoring or as a laboratory procedure. In either case UV-VIS spectroscopy is a time and money saving alternative to traditional chemical methods.
What is a Triazine?
Atrazine, a triazine, is a restricted use pesticide in the United States. It is one of the most commonly used herbicides in the US particularly in the mid-western “corn belt”. It is considered slightly toxic, believed to be an endocrine disruptor and is a suspect carcinogen. Atrazine is a common contaminant in ground and surface water where it is slow to degrade. Agricultural runoff is the major source of surface water contamination. The US EPA Maximum Containment Level Goal (MCLG) for drinking water is 3ppb. The UV-VIS region of the electromagnetic spectrum displays electronic transitions and is particularly useful for viewing conjugated and aromatic molecules. By measuring the UV spectra of a series of samples of known triazine concentrations, quantitative models can be developed which will allow the measurement of future samples based only on their UV spectrum. Our analyzer systems use fiber optics to allow the sample probe to be located in remote locations away from the spectrometer itself, potentially reducing the level of operator intervention and providing real time sample assessment.
How to Measure Triazines in Water?
The triazines were initially diluted in isopropanol and then serially diluted with deionized water. The UV spectra were measured using a 508 UV-VIS™ Full Spectrum Process Analyzer in a 100mm path length flow cell. Isopropanol is UV transparent. The unit was referenced using water, allowing the spectral features attributed to the triazines to be more easily seen. Figures 1 through 3 shows the absorbance spectra collected for atrazine itself baseline corrected at 330 and 350nm.
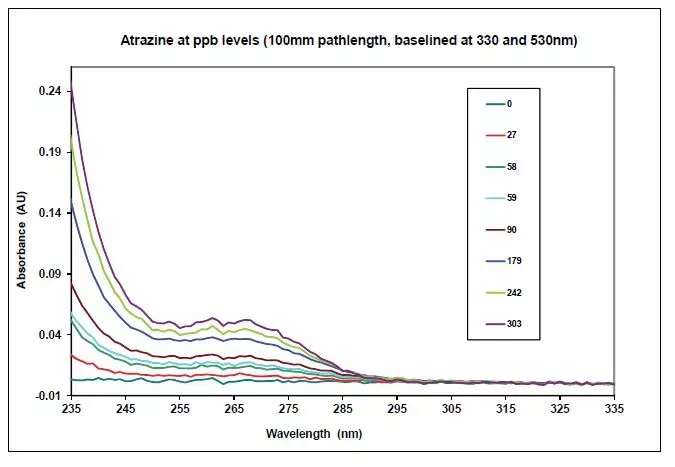
Figure 1: Absorbance Spectra of Atrazine Baseline Corrected at 330 and 530nm


SALES | TRAINING | SERVICE
Americas +1.916.638.4944
EMEA +49 69 20436910
China/APAC +86 400 086 0106
USEFUL NIR UV-VIS Troubleshooting Guides & Technical Resources


Figure 2: Absorbance Spectra of Propazine baseline corrected at 330 and 530 nm

Figure 3: Absorbance Spectra of Cyanuric Chloride, a Triazine Precursor, Baseline Corrected
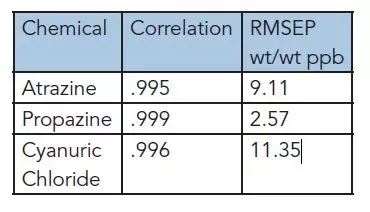
Table 1
Analysis of Triazines in Water UV-Vis Spectra
First derivative spectra preprocessing was used to eliminate baseline shifts. PLS models were then created for each chemical. Results shown in table 1.
The measurement of ppb level atrazine, propazine, or cyanuric chloride concentrations in water using UV spectroscopy is both fast and reliable utilizing the 508 UV-VIS™ Full Spectrum Process Analyzer. This method minimizes the need for laboratory sample collection. Results are available in real-time (seconds) for triazine concentrations in aqueous streams. For more detailed information regarding system specifications please contact a Process Insights technical sales specialist.