Binary solvent mixtures are used as carriers in production scale pharmaceutical high-performance Liquid Chromatography (HPLC) separations. Analysis of the mixture ratios is required prior to injection into the HPLC column. The correct mixture ratio ensures efficient and correct separation of the chemical targeted for separation. Concentrations of individual solvents can be measured over the entire range from 0 to 100%.
For more than three decades, NIR spectroscopy has been used to measure composition in a wide variety of chemical, petrochemical, and agricultural applications. NIR technology, equipment, software, and methods are quite mature and sophisticated.
As an example of the ability of Near Infrared (NIR) Spectroscopy to measure the concentration ratios of binary mixtures, we undertook the experiments outlined below using two different mixtures:
1) Heptane / Ethyl Acetate
2) Methylene Chloride / Ethyl Acetate
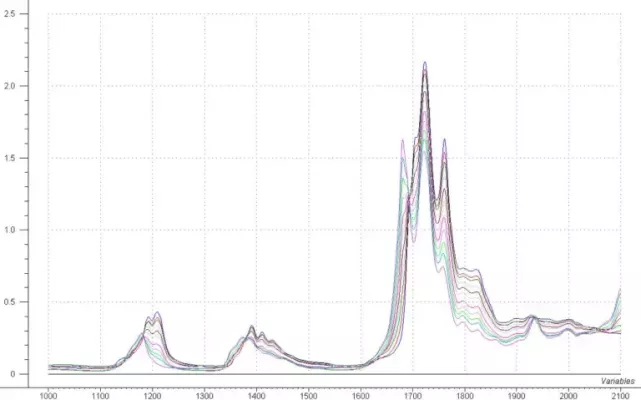
Figure 1: Heptane / Ethyl Acetate Mixture Spectra
Introduction to Binary Solvent Mixtures
Binary solvent mixtures are used as carriers in HPLC columns to extract drugs and drug precursors during the manufacturing process. Accurate control of the composition of the mixture is crucial for accurate and efficient separation of the desired pharmaceutical compounds. Online measurement of the composition of solvent mixtures is made possible using NIR spectroscopy. NIR spectroscopy is ideal for measuring clear liquids online since the analyzer can be remotely located and connected to a flow cell or in-line probe via fiber optic cables. This remote measurement capability makes NIR an excellent choice for measurements on flammable or explosive liquids, minimizing both exposure and safety risks. Our GUIDED WAVE™ NIR spectrometers have excellent signal-to-noise ratios, superb long term stability, multi-channel capability and provide fast and reliable results.
The feasibility experiments described below involve binary mixtures of heptane / ethyl acetate and methylene chloride /ethyl acetate. These are just two examples of binary solvent mixtures frequently used in preparative scale HPLC separation separations.
Experiment to Measure Binary Solvent Mixtures
The binary mixtures were prepared by weight in the laboratory. NIR spectral scans were collected with our GUIDED WAVE NIR-O™ Dual Beam Full Spectrum Process Spectrometer (1000 nm to 2100 nm). The sample path length was 5 mm. The sample cell was connected to the spectrometer by two lengths of 20 m long, 500 μm diameter low-OH optical fiber. Each scan consisted of an average of 4 scans for a total data collection time of 16 seconds.
Analysis and Results
Part 1 – Heptane and Ethyl Acetate
The concentrations of the calibration samples range from 0 – 100% in both Ethyl Acetate and Heptane. The raw spectral data are shown in figure 1. There are many regions that show changes in the spectral date as a result of the concentration differences. The absorbance region in the first overtone (1600 – 1800 nm) is greater than 1AU for several of the samples. Focusing the data on the region between 1100 and 1600 nm would allow the sample pathlength to be expanded to a 10 mm gap with no decrease in performance.
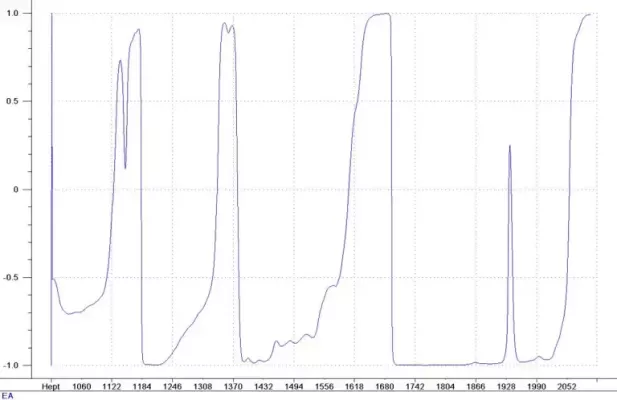
The correlation coefficients of the spectral data to Heptane and Ethyl Acetate concentrations are shown in Figures 2 and 3. There are many regions of the spectral data with very high correlation to the concentration. This is a good indication that the calibration will predict the component concentrations accurately. It is also an indication that either PLS or MLR calibration techniques will work for this application. PLS calibration provides a robust model that can detect unusual samples or samples with contaminants and warn the user of the situation. MLR provides simple, easy to understand calibration models that could even be used in conjunction with a photometer measurement.
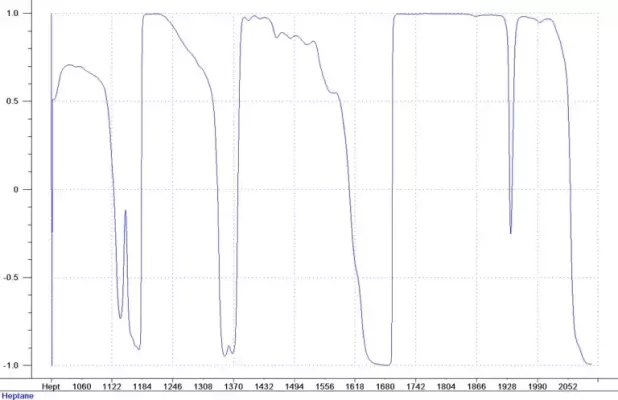
Figure 2: Correlation – Heptane


SALES | TRAINING | SERVICE
Americas +1.916.638.4944
EMEA +49 69 20436910
China/APAC +86 400 086 0106
USEFUL NIR UV-VIS Troubleshooting Guides & Technical Resources

Figure 3: Correlation Ethyl Acetate
For this example, a first derivative was applied to the spectral data. This removes irrelevant spectral changes and helps to focus on the spectral changes that result only from the chemical concentration differences. PLS calibrations were generated for both components using the full range of spectral data. For Heptane, the calibration results are shown in Figure 4 and for Ethyl Acetate in Figure 5. The estimated prediction uncertainty is 0.1% for both the Heptane and the Ethyl Acetate measurements.
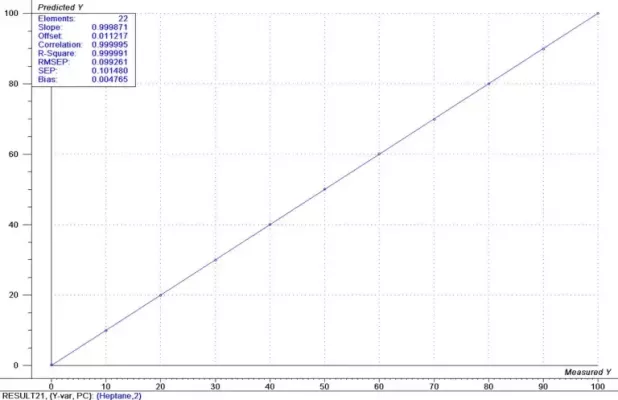
Figure 4: Results Heptane
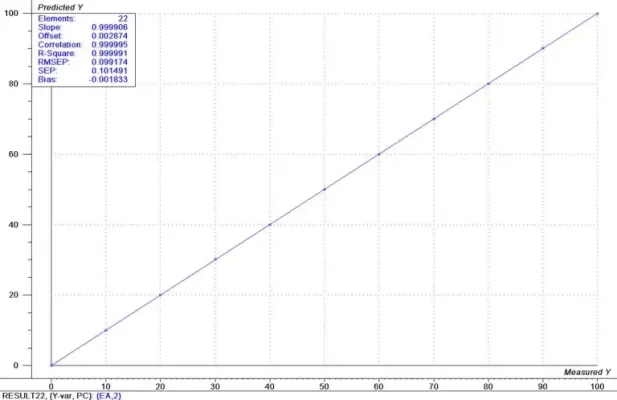
Figure 5: Results Ethyl Acetate
There are ways to potentially improve this accuracy depending on the actual need. Often times a model will provide more accurate predictions if it is focused on a narrower range of concentrations. Also, improvements in calibration sample preparation will always be of value.
All of our GUIDED WAVE sample probes allow for easy interaction with the sample. The probe can be placed directly in a vessel or reactor or it can be placed on a flow loop. This configuration will allow the direct measurement of Heptane and Ethyl Acetate with one simple scan.
Part 2 – Methylene Chloride and Ethyl Acetate
The concentrations of the calibration samples range from 0 – 100% in both Ethyl Acetate and Methylene Chloride The raw spectral data are shown in Figure 6. There are many regions that show changes in the spectral data as a result of the concentration differences. The absorbance region in the first overtone (1600 – 1800 nm) is greater than 1AU for several of the samples. Again, a sample path length of 10 mm can be used if the wavelength region is narrowed to 1100 – 1600 nm.
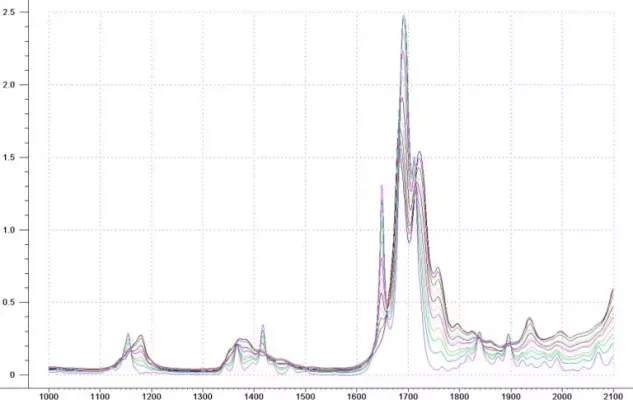
Figure 6: Methylene Chloride / Ethyl Acetate Mixtures
The spectral data has many regions that show a strong correlation to the component concentrations. Similar modeling techniques as used in the previous data produce models with prediction accuracy of approximately 0.10% for both constituents. These results are shown graphically in Figures 7 and 8.
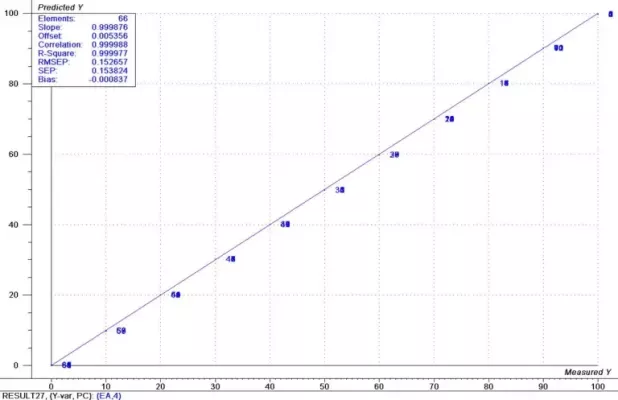
Figure 7: Results Ethyl Acetate
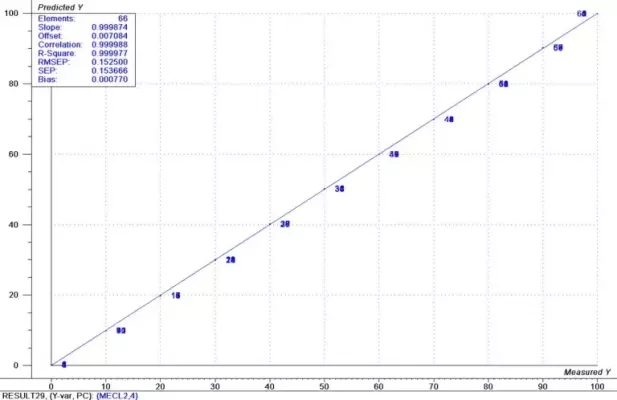
Figure 8: Results Methylene Chloride
Conclusion
Measuring solvent mixture concentrations with very good accuracy by NIR spectroscopy is demonstrated. The examples shown here for the two different binary solvent mixtures can easily be implemented either as online or laboratory measurements. These measurements can be made with either a full spectrum analyzer like our GUIDED WAVE NIR-O or with a smaller photometer unit such as our ClearView® db. The choice between the measurement technologies is dependent on the environment where the measurement is to be made.
If strict control and warnings of unusual sample conditions are needed, or if the ability to measure multiple physical sample points is required then the full spectrum analyzer is indicated. For a simple quantitative measurement in a known sample environment the photometer unit would provide the necessary information. A spectrometer may also be preferred for laboratory measurements where different analytical procedures may be run on a single instrument. In all cases, measurement is facilitated by the remote sample probe and fiber optics. This remote probe capability allows the sample probe to be placed up to one hundred meters away from the analyzer. Robust analyzer hardware eliminates error related to wavelength instability and drift.
Our comprehensive GUIDED WAVE NIR UV-VIS process and lab analyzer spectrometers offer optically matched components and a meticulously planned calibration approach, ensuring long-term efficiency and cost savings. Our advanced systems are engineered for continuous online operation, delivering real-time data of laboratory-grade quality, even in the harshest processing plant conditions.