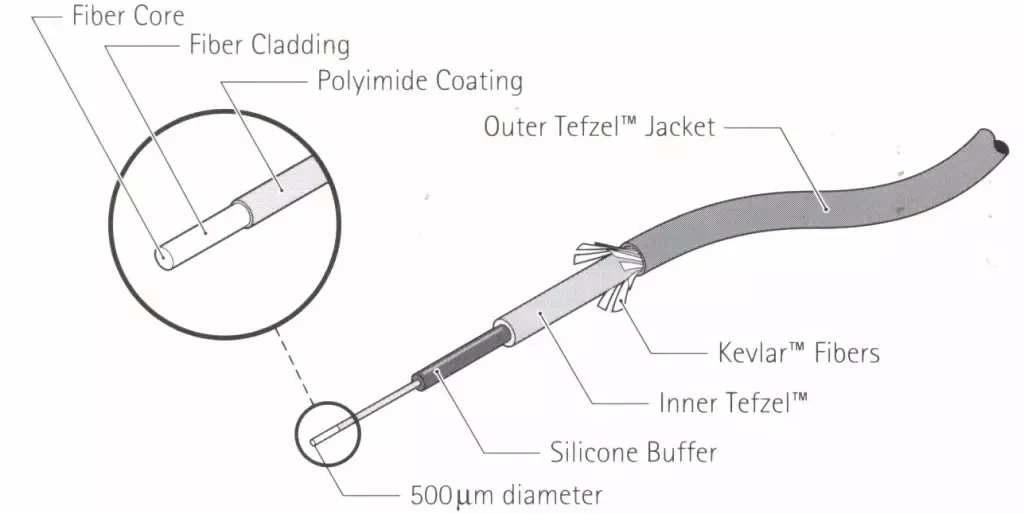
Signal stability and low noise in remote spectroscopy depend upon fiber optics with high transmission. The transmission must be affected very little by environmental influences such as temperature, vibration, and ambient light levels. From a patented fiber design to our emphasis on high-quality materials, our spectroscopic grade fiber optic cable is designed for the highest performance in transmission efficiency and durability. A polyimide coating and a patented silicone-based buffer protect the fiber as well.
For critical spectroscopic measurements, our engineers developed a special formulation of thermally stable 500-micron and 600-micron near-infrared (NIR) fiber optic cable. The 500-micron fiber core was optimized for use with our NIR-O Full Spectrum spectrometer and the ClearView db (dual beam) photometer but can also be used with any other fiber optic-based analyzer brands.
Explore our high optical efficiency insertion probes and flow cells.
Prove the Value
Thermally Stable Fiber Optics – NIR readings during 30-45 C○ Thermal Cycling
To prove the value of our NIR fiber, a 50m spool of thermally stable fiber optic cable and a 50m spool of a competitor’s brand fiber optic cable were loaded into the environmental chamber. Both fibers were then connected to a NIR-O Full Spectrum Analyzer. After referencing both fibers, a thermal cycling routine on the oven was performed overnight (30-45C○ two cycles). Spectra of each fiber spool was collected once every 10 minutes.

Figure 2: Fiber spools loaded into environmental oven.

Figure 3: Thermal Cycling at 30-45 C○
Reducing Signal Drift Due to Natural Thermal Variation
The jacketing design of the thermally stable NIR fiber optic cable reduces drift in the analyzer system. Fifty meters of both the Guided Wave thermally stable fiber and the competitor’s fiber was spooled out on the factory floor and connected to a NIR-O Full Spectrum Analyzer, a zero or reference was collected. The analyzer was then scheduled to collect one spectrum on each fiber optic cable once a minute over 3 days.

Figure 4: Both brands of fiber optic cable unspooled on the factory floor.
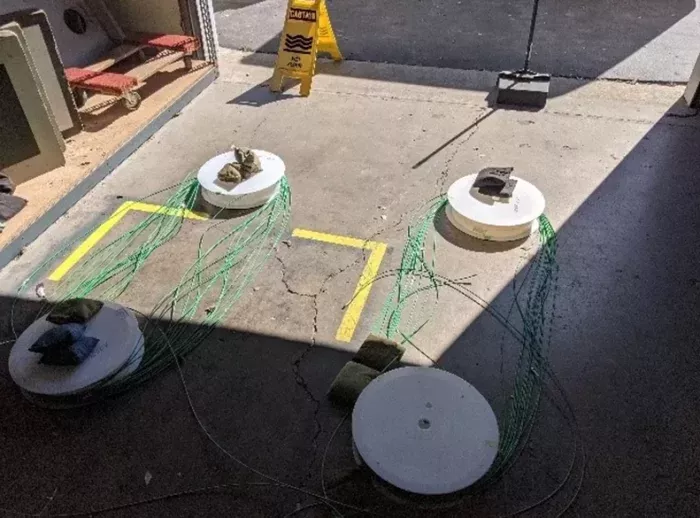
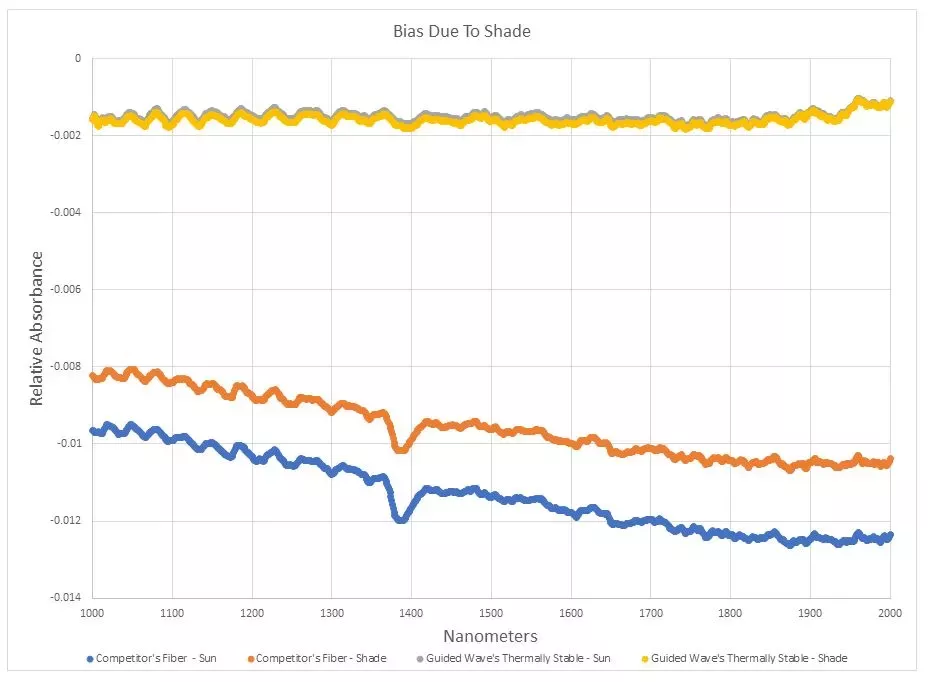
Figure 5: Seventy-two hours of drift data. Shows the average of all the spectra collected over the 3 days. The blue line which drifted ~4 mAu, is the competitor’s traditional fiber. The orange line which stayed close to zero is the thermally stable fiber.

Figure 6: Official Guided Wave cornhole board acting as a sunshade.