Water in Acetic Acid & p-Xylene with a ClearView db Filter Photometer
Can quantitative analysis be done with a multiple wavelength filter photometer?
The spectra of this 3-component mixture are complex. Initial visual inspection suggests that a complete spectrum and multivariate analysis (PLS – partial least- squares) are required.
Spectra were taken with an In GaAs diode array spectrometer and low-OH optical fibers. Thirteen samples were analyzed at 50°C in a 5 mm quartz cuvette.

Americas +1.916.638.4944
EMEA +49 69 20436910
China/APAC +86 400 086 0106
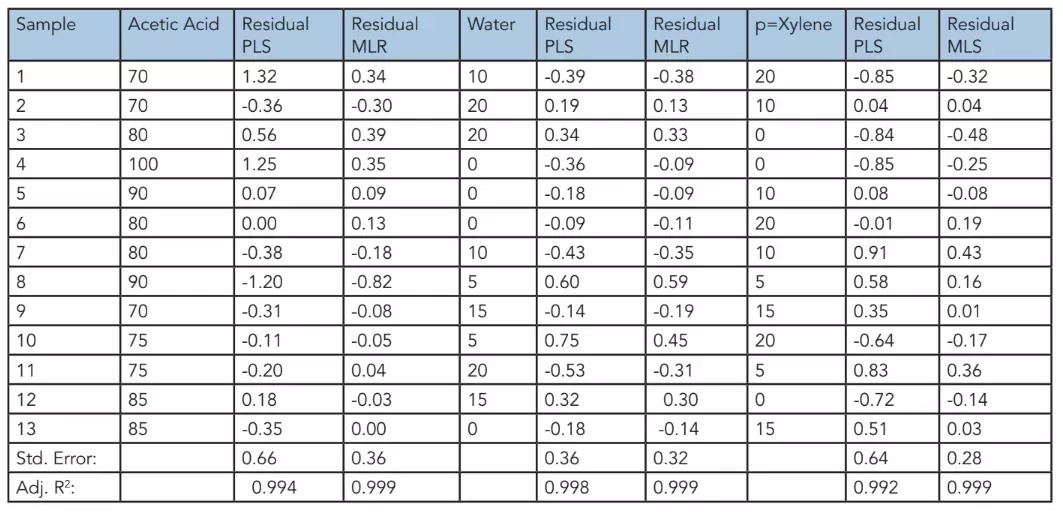
A Partial Least Squares Regression (PLSR) model was created. The results show reasonable predictions in the table below. PLSR uses the complete spectrum for quantitative analysis. It is apparent from the spectra, however, that water can be analyzed near 1380 nm, independent of p-xylene or acetic acid content. Multiple linear regression (MLR) systematically investigates which wavelength or wavelengths provide a statistically acceptable calibration. The MLR results confirmed that water can be determined solely at 1390 nm, and that acetic acid and p-xylene can be determined using two wavelengths at 1140 and 1380 nm.
The results are also presented in the table below, showing a standard error for the calibration near 0.3% (vol.) for each component, which is equivalent to the PLSR results.
Our GUIDED WAVE™ ClearView® db fiber optic, filter photometer system can provide quantitative analyses of water, p-xylene and acetic acid using 1390nm, 1140nm, 1380 nm and 1080 nm (reference) filters.
